mieducation
iCare Home2 Tonometry: Towards Clinically Useful Patient-Derived Data
Increasingly, individuals are assuming a greater role in managing their health conditions. Patient-derived data has transformed the management of several chronic diseases, such as hypertension and diabetes, where patients measure their own blood pressure or blood sugars and share this information with their health care providers to guide medication dosage adjustments. Glaucoma, with its pressure-dependent treatment target, is in a similar category; however, until recently there has been no appropriate tool for patient-derived measurements. The iCare Home2 tonometer offers real promise as a first step into this area.
In this article Professors William Morgan, David Mackey, and Andrew Turpin illustrate some of the strengths and limitations of the system. They also show an interesting, but typical, patient dataset.
WRITERS Professor William Morgan, Professor David Mackey AO, and Professor Andrew Turpin
LEARNING OBJECTIVES
On completion of this CPD activity, participants should be able to:
1. Understand why home monitoring of intraocular pressure (IOP) can be beneficial when managing patients with glaucoma,
2. Realise the accuracy of iCare Home2 IOP monitoring,
3. Understand how to analyse data generated, and
4. Be aware of steps necessary to prepare patients to use the iCare Home2.
Rebound tonometry was described by Kontiola in 1996 and introduced as the iCare tonometer.1 The iCare Home2 tonometer was introduced in 2014. Initially expensive, the price is now approaching AU$2,000, which is affordable for a subset of patients. The probes are an additional cost, but these can be reused, as long as they are used on the same person.
The system is accurate to within a 95% Bland-Altman confidence interval of about ± 5 mmHg.2 There is almost no bias, which essentially means that if enough measurements are taken, the mean of those measurements reasonably accurately approaches the true underlying intraocular pressure (IOP).3,4 In the studies published so far, this so-called true underlying IOP is taken as the Goldmann applanation reading, which in itself can be inaccurate.5 It would appear to be a reasonable assumption that when multiple rebound tonometry measures are taken, the mean or distribution of those pressures reasonably represents the underlying IOP distribution and trend. Notably, the error of rebound tonometry is higher in patient self-usage compared with expert usage of the system.3 However, the above-mentioned statistical premise applies given that the bias is near zero.
Patients require some training and practice to accurately use the iCare Home2. In the published studies, approximately 80% of patients can use the system, thus up to 20% of patients cannot.3,4 Many very elderly patients may not be sufficiently dextrous to use the Home2. Other factors, typically related to medication adherence, are also relevant. However, there is increasing interest in whether the iCare Home2 can assist in validating treatment decisions.6
CASE STUDY
We present a patient from our clinic who has been followed for approximately 10 years and in whom confocal scanning laser tomography scans, and optical coherence tomography (OCT) nerve fibre layer scans appeared to detect a slight change in the patient’s left eye in 2022. The left IOP at four to six monthly intervals with Goldmann applanation tonometry had ranged from between 15 to 17 mmHg but one measurement was up to 20 mmHg. Latanoprost drops were commenced in late 2021 and the left IOP stayed at between 15 and 16 mmHg, again using interval measurements with Goldmann applanation tonometry. We were unsure of the therapeutic effect and the changes seen on scanning were very small, so the diagnosis of preperimetric glaucoma was brought into question. In discussions with the patient, we decided to cease medication to see what IOP and other changes occurred following cessation.
Further discussions with the patient concerned the purchase of an iCare Home2 tonometer, which the patient did acquire three months following cessation of latanoprost. The individual was instructed to use the tonometer two to three times per day. Further scans were taken some months later, which confirmed and showed slight further subsequent change on both confocal scanning laser tomography and OCT scanning of the nerve fibre layer. The diagnosis of preperimetric glaucoma in the left eye appeared certain and so the patient was restarted on latanoprost to both eyes in June 2023. The IOP remained at 15 mmHg in the left eye. However, one can see, using the raw output from the iCare Home2 system ( Figure 1), what appears to be a reduction in mean IOP with a scatter of data, appearing to reflect a drop in pressure in that left eye.
DATA OUTPUT AND ANALYSIS
In the data output from the system, there are four plots, with the two most useful plots being the scatterplot with the line linking each eye (Figure 1). The other useful plot is the diurnal plot (Figure 2) showing the standard error bars at each three-hour period through the day. We are interested in the diurnal variation, given the possible links between pressure peaks and further glaucomatous progression.7 Here one can clearly see a tendency for IOP rise during the day and then a decline in the evening. To acquire the data, we instruct patients to take their IOP three times a day, but at varying times of the day so that over time, a broad distribution of pressures and times is recorded.
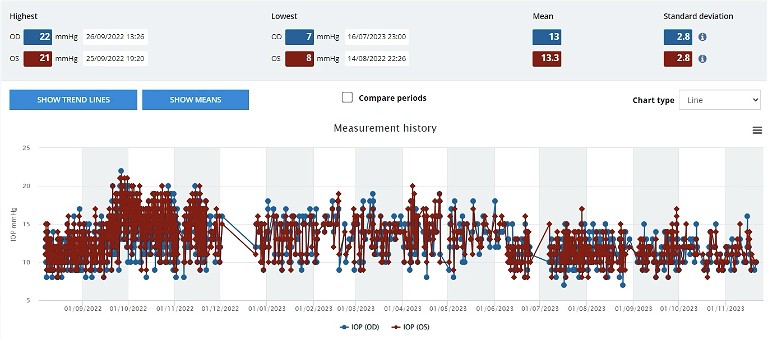
Figure 1. Visual output from the home iCare system cloud-based database. Line scatter plot graph of patient generated home iCare IOP data for each eye: right (blue) and left (red).Summary statistics are also presented.
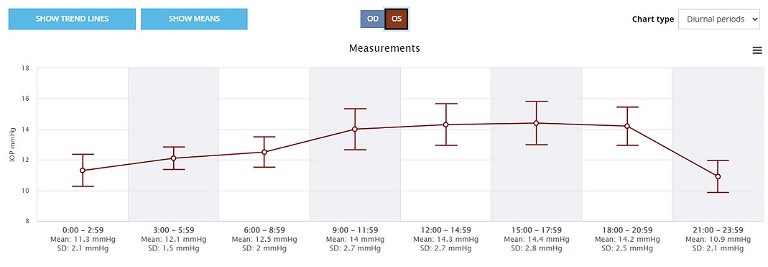
Figure 2. Diurnal IOP graph from the home iCare system cloud-based database. The IOP data is grouped into three-hour bins across the 24-hour period with the mean and standard deviation (bars) shown.
One problem with the data output from the iCare clinic system at present is that one cannot compare diurnal pressure periods. That is, we cannot compare the diurnal pressure variation prior to treatment as opposed to that after treatment. We simply see an average result over time across the entire recording span. In contrast, the scatterplot can be compared at two different time periods, and the plots over laid, as shown in Figure 3.
It is possible to extract data from the clinic system as a comma separated values (CSV ) file. Using this download, we then plot our own graphs and tend to prefer boxplots to standard error bars, although either is reasonable, as long as one understands the statistical limitations.8 Standard errors reflect the expected limits of the estimated mean IOP values, whereas box plots express the overall data scatter. In Figure 4, one can see a box plot of the raw data over time and can clearly see a drop in mean and scattered pressures from June when the latanoprost treatment was restarted. To refresh, a boxplot demonstrates the data scatter, with the box occupying the first quartile (25th percentile) to third quartile (75th percentile) and hence the interquartile range. The median is the horizontal line within the box. The outside lines from the box lead to the datapoint furthest away but within 1.5 times the interquartile range.
Box plots allow a more realistic view of the data scatter, which one can see comparing left eye data from Figure 5. This shows the diurnal IOP distribution at two-hourly intervals over the same time-period as the left eye data in Figure 2.
Also, we can plot the change in diurnal pressures before and after a certain date (Figure 6). One can clearly see a reduction in the diurnal IOP, particularly during the middle of the day when the IOP was peaking.
These box plots probably present the easiest visualisation of the data for the treating clinician in a busy clinic. This allows one to be reasonably confident that the treatment is working in terms of reducing IOP significantly and also reducing the diurnal pressure variation.
A major problem with glaucoma treatment monitoring has been the very episodic pressure measurements, and the fact that we often never know if we are simply observing a regression towards the mean or outlying data measurement effect. That is, when we measure a somewhat elevated pressure, it may be an outlying data measurement. In this scenario we are tempted to change our treatment, believing that we have identified an elevated pressure. Then the next time we see the patient, the measurement may have fallen back towards the mean. We believe that we have achieved a therapeutic outcome when perhaps, in many cases, we have simply witnessed normal variation in data measurement. One value of the iCare Home2, or frequent patient-derived pressure data in this setting is that it helps remove this problem, particularly when patients acquire sufficient data to allow accurate estimates. The reverse problem probably also occurs, such as in this patient, where a pre-treatment IOP may be close to the mean or low, but post-treatment an elevated, more outlying value is measured, suggesting that the treatment is not working.
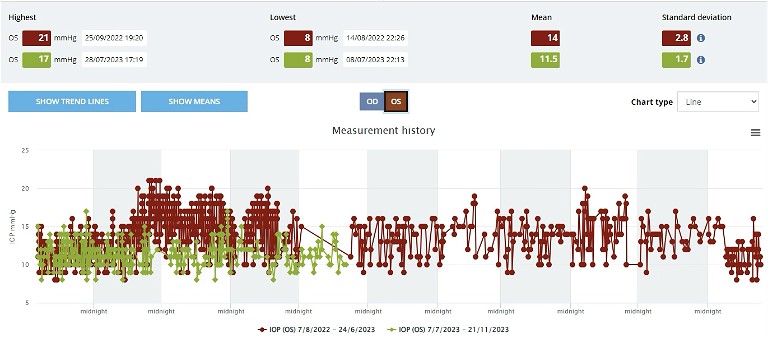
Figure 3. Visual output from the home iCare system cloud-based database. Line scatter plot of IOP distribution at two separate time periods, before (red) and after (green), beginning treatment in June 2023.
RECENT IMPROVEMENTS
The iCare system and data output have been improved over the past year and the current graphs are useful in the clinic. Further improvements could be made to produce box plots of the raw data over time, to more clearly identify trends in pressure, as shown in Figure 4. Also, it would be very useful to have diurnal IOP comparisons illustrated graphically, such as in Figure 6. It is likely that further developments in data analysis will enhance the clinicians’ overall monitoring of the patient. While the initial linking of the iCare Home2 to the cloud-based clinic system is a little fiddly, involving a mobile app, Bluetooth connections, and emailverified passwords, once set up it easily allows automated data export to the cloud, receivable by the monitoring clinician.
In our experience, we have one tonometer that we loan to patients for three weeks and we encourage them to take three measurements per day at different times of the day, allowing a diurnal pressure curve to be generated. This advice is consistent with other studies using rebound tonometr y performed by patients at home.9 This, and the overall pressure comparison, appears to be very useful in our clinical management. Many of these patients go on to purchase an iCare Home2 system and currently we have quite a number of patients where the data is automatically linked to our electronic medical records system, and we can view their data when they arrive in the clinic. This patient self-derived data acquisition more directly involves patients in their own care, giving them greater understanding of the link between IOP and therapy, and it appears to enhance medication adherence.
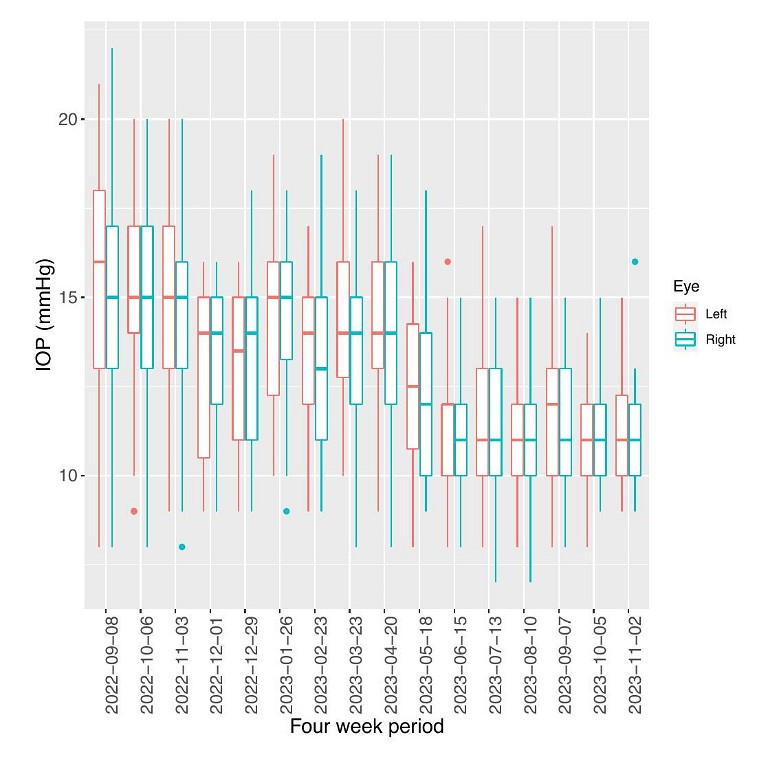
Figure 4. Box plots of IOP over four-week periods with the start of the four-week period labelled on the x-axis. Both left (red) and right (blue) eye data is included.
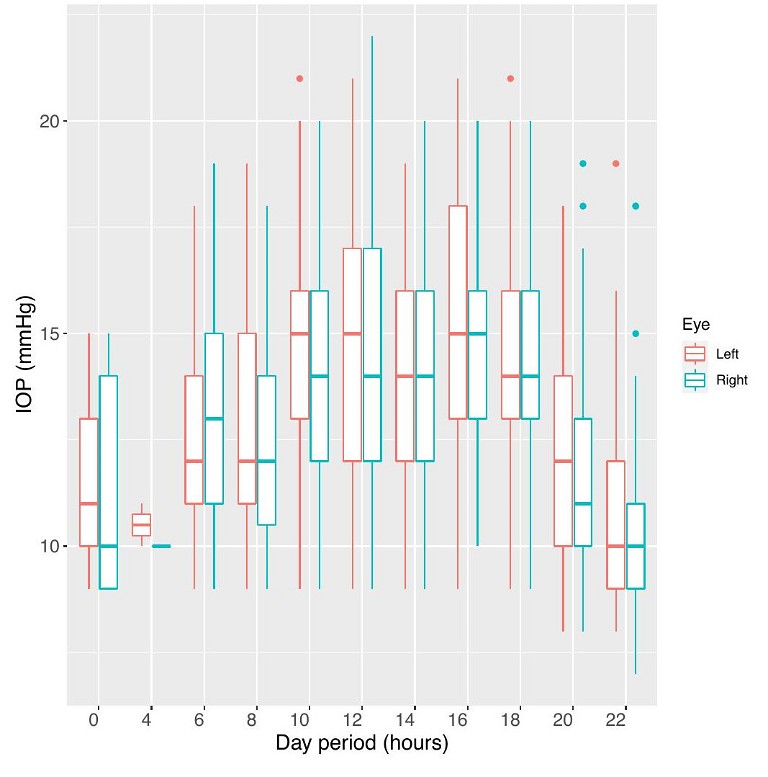
Figure 5. Box plots of IOP grouped into two-hour bins, with the start time labelled on the x-axis. Both left (red) and right (blue) eye data is included.
Another use of the system is that one can set IOP notification limits for patients. For example, you may wish to be alerted when a patient has an IOP measurement over a certain limit (e.g., 30 mmHg). The system can be set to send a notification email to your specified email address to alert you or staff. This has proven useful and prompted earlier treatment changes.
The system does require staff time for training, setting up the data communications and connection, training the patient on the data connection and upload, as well as training the patients to use the rebound tonometer. The demand on our device is now so large that we have a four-month waiting list for the loans, and we are looking at acquiring several more.
POTENTIAL FOR MORE
The iCare Home2 system appears to be the first very useful system for self-acquisition of IOP data by patients. It is changing the way we manage patients and is giving us and our patients greater confidence in the effectiveness of our treatments. It is involving them more in their own care. It is also providing us with information as to why certain patients with apparently normally IOPs at clinical visits are progressing. We do look forward to further reductions in the cost of home IOP monitors, the enhanced availability for patients, and refinements in the data analysis and presentation to clinicians.
To earn your CPD hours from this article, visit: mieducation.com/icare-home2-tonometrytowards-clinically-useful-patient-derived-data.

References
1. Kontiola, A., A new electromechanical method for measuring intraocular pressure. Doc Ophthalmol 1996;93(3):265–76. DOI: 10.1007/bf02569066.
2. Che Hamzah, J., Daka, Q., Azuara-Blanco, A., Home monitoring for glaucoma. Eye (London, England) 2020;34(1):155–60.
3. Dabasia, P.L., Lawrenson, J.G., Murdoch, I.E., Evaluation of a new rebound tonometer for self-measurement of intraocular pressure. The British Journal of Ophthalmology 2016;100(8):1139–43. DOI: 10.1136/bjophthalmol-2015-307674.
4. Valero, B., Fénolland, J.R., Rosenberg, R., et al., [Reliability and reproducibility of introcular pressure (IOP) measurement with the iCare Home rebound tonometer (model TA022) and comparison with Goldmann applanation tonometer in glaucoma patients]. Journal Francais d'Ophtalmologie 2017;40(10):865–75. DOI: 10.1016/j.jfo.2017.06.008.
5. Sudesh, S., Moseley, M.J., Thompson, J.R., Accuracy of Goldmann tonometry in clinical practice. Acta Ophthalmol (Copenh) 1993;71(2):185–8. DOI: 10.1111/j.1755- 3768.1993.tb04988.x.
6. Scott, A.T., Kanaster, K., Kaizer, A.M., et al., The utility of iCare Home tonometry for detection of therapy-related intraocular pressure changes in glaucoma and ocular hypertension. Ophthalmology Glaucoma 2022;5(1):85–93. DOI: 10.1016/j.ogla.2021.05.007.
7. Zeimer, R.C., Wilensky, J.T., Gieser, D.K., et al., Association between intraocular pressure peaks and progression of visual field loss. Ophthalmology 1991;98(1):64–9. DOI: 10.1016/s0161-6420(91)32340-6.
8. R: A Language and Environment for Statistical Computing [program]. 2.7.1 (2008-06-23) version. Vienna, Austria: R Foundation for Statistical Computing, 2008.
9. Sakamoto, M., Kanamori, A., Mori, S., et al., [Home monitoring of intraocular pressure and it’s diurnal patterns using iCare Home]. Nippon Ganka Gakkai Zasshi 2017;121(4):366–72.

Professor William Morgan MBBS PhD FRANZCO is Managing Director of the Lions Eye Institute, Professor of Ophthalmology at University of Western Australia, a glaucoma subspecialist, and scientist researching effects of pressure upon the eye.

Professor David Mackey AO MBBS MD FRANZCO FRACS FAHMS FARVO is Professor of Ophthalmology at University of Western Australia. He is a clinician and scientist with long interest in the genetic contributions to components of glaucoma, including IOP.

Professor Andrew Turpin BCom BSci(Hons) PhD is Professor of Ophthalmic Data at Curtin University and has established the data links for this and other patient-derived data. He is also exploring new visual field and structure – function algorithms. Prof Turpin is a consultant to Centrevue and iCare.